

Most small,medium and large sized businesses have invested in a website and online marketing but they do not measure the effectiveness of their digital marketing efforts. This article outlines 3 reports you can use in Google Analytics (GA) to measure how customers engage with your website and how you can measure the effectiveness of your email campaigns, online advertising and social media activity. This article will help you to invest with confidence in promoting your business.
There are many website analytical tools, such as Kissmetrics, Crazyegg etc, but this article focuses on GA because it is one of the most commonly used free tools that provides businesses with an abundance of data about website activity.
Measuring Your Success
It is surprising how many businesses do not use any analytics tools to measure website traffic and activity. When I work with such businesses they would say that they get most of their business from Facebook or they tried advertising and it doesn’t work etc but in truth they don’t know because they are not measuring it.
GA provides you with an abundance of data that can help you decipher the effective marketing activities from the ineffective. Too much data can be overwhelming but my advice is to keep it simple and the following reports will help you do this:
Traffic Acquisition Report
In my opinion, this is one of the most informative reports in GA because it identifies the source of your traffic. To access it: Log into GA, in the left hand side column of the dashboard click on “Acquisition” and select “Overview” or “All Traffic” and “Channels”. As you can see from the image below you are presented with a list of traffic sources. *if you choose the latter option, i.e “All Traffic” and “Channels”, you can view additional information such as “Bounce rate”, “Pages/Session” and more.
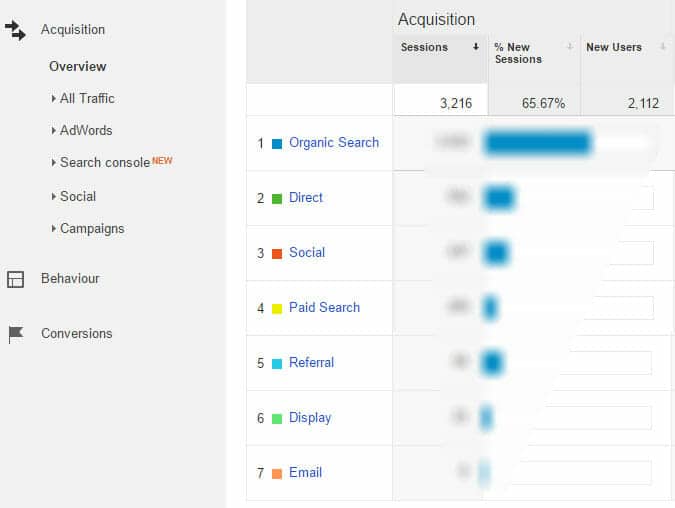
Source: Google Analytics
In this report, if you click on the name of the traffic source it will give you a further break down of traffic. For example if you click on “Social” it will display traffic from Facebook, Twitter, Linkedin etc. The traffic sources explained:
- Organic Traffic: This is free traffic that comes to your website from search engines, such as Google, i.e when a person clicks your website listing in the organic search engine results page (SERPs).
- Direct Traffic: This is when a person types your url or domain name directly into the browser or they clicked a bookmarked link etc.
- Social Traffic: This is website traffic generated from social media activity.
- Paid Search Traffic: This is traffic generated from Google Ads, Bing Ads etc.
- Referral Traffic: This is traffic generated from other websites: when a person clicks a link to your website on another website, for example a directory listing.
- Display Traffic: This is traffic generated from display or banner advertising with providers such as Google Display Network (GDN).
- Email Traffic: This is traffic generated from your email campaigns.
Immediately, you can see how valuable this report is to your business. It tells you which channel is generating the most traffic to your website. With this report, you can measure the traffic generated from PR campaigns, social media, SEO, search engine advertising, banner campaigns, email campaigns and much more. If one campaign worked well, you can replicate it or if one campaign didn’t work you can examine why and modify it in the future or stop using it.
Landing Page Report
A landing page is the first page a visitor visits or lands on when visiting your website.The landing page report tells you the pages that attract the most traffic to your website. To access this report: Log into GA, in the left hand column select “Behaviour”, select “Site Content” and “Landing pages”. You will be presented with a dashboard similar to the image below.
The most popular landing pages are listed in numerical order. The “Bounce rate”, i.e the percentage of customers who visit just that page, they don’t take any action and they leave the website, combined with the “Pages/session” and “Avg session duration” can tell you if you are attracting the right visitors to your site and their level of engagement with your website.
In general, if a page has a very high “Bounce rate” and a low “Avg session duration” this can indicate a bad user experience, a poorly designed page, irrelevant content, a technical issue with slow page load time and poor targeting of potential customers. The data needs to be interpreted based on the industry you operate in and your traffic source, for example, pages on a news website using social media to drive website traffic may have a very high “Bounce rate” because visitors only read one news article and leave the page.
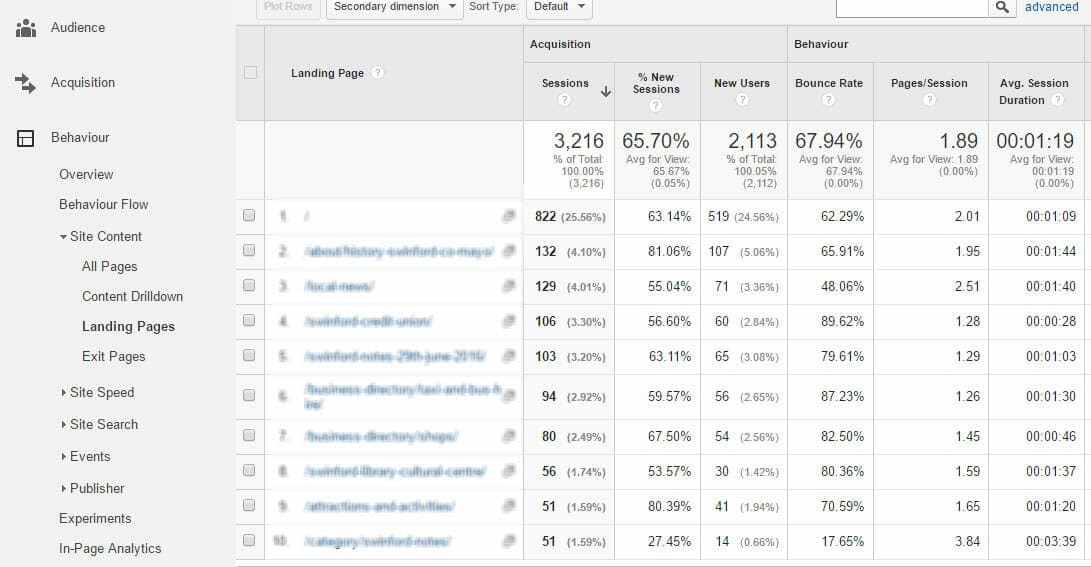
Source: Google Analytics
New Visitors Vs. Returning Visitors Report
Based on research by Mckinsey’s into the customer purchasing decision journey most first time visitors to your website will not purchase from you on their first visit. Customers, when deciding to buy a product or service, go through a process of initial consideration of the various brands or companies who sell the products or services they need or want, they actively shop around and evaluate all of the information available, i.e visiting company websites, social media, word of mouth (WOM) and finally, they reach the moment of purchase.
The “New Vs. Returning Visitors” report tells you the level of visitors who are returning to your website. As you can see from the image below, returning visitors, in this example and in general, have a considerably lower bounce rate, they visit more pages and they spend more time on the website. This indicates that they are becoming more loyal to your brand, your website is building trust with visitors and ultimately, returning visitors will more likely become customers.
To access this report: Log into GA, in the left hand column select “Audience” then select “Behaviour” and finally select “New vs Returning”.
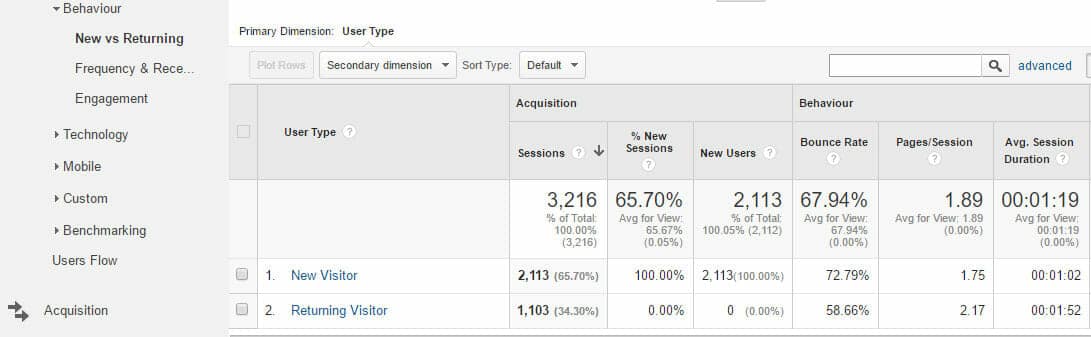
Source: Google Analytics
Conclusion
Measuring a return on investment from your digital marketing activities is essential for your business. There is no point in you investing money in a website and then spending your precious time on social media targeting potential customers, running email campaigns, engaging in PR campaigns and using paid advertising to drive traffic to your website without knowing which channel is giving you the best return on investment.
The three Google Analytics reports mentioned in this article, are easy to access and can give you valuable information that will help you identify the advertising channels that are working for your business and those that are not. Knowing this, will allow you to invest in digital marketing with confidence.
Featured image by Geralt / Pixabay.com

I hold an MSc in Digital Marketing from Michael Smurfit Graduate Business School, UCD and I am Google Adwords Certified.
If you would like to discuss what we can do for your business you can contact me on (083) 1026964 or email: cathal@www.www.enablemarketing.ie
- Minister Michael Ring Launches P. O’Connor & Son Website - April 19, 2018
- What Style Of Leader Are You? - October 26, 2016
- Mobile Friendly Websites Have Become Way More Important - October 17, 2016


Trackbacks/Pingbacks